Silver Preview Free access for a limited time

FP&A analysis, forecasting & scenario planning

Stop rebuilding budgets. Start making better financial decisions.

When business complexity outgrows your financial planning process, every change of assumption can trigger another round of spreadsheets. Explore how Planova connects budget vs actual analysis, line-item forecasting and three financial scenarios in one FP&A experience.

Try the public Silver Preview with synthetic Aurelia Sensors data. No registration or company data required. AI explanations are disabled during the Preview.

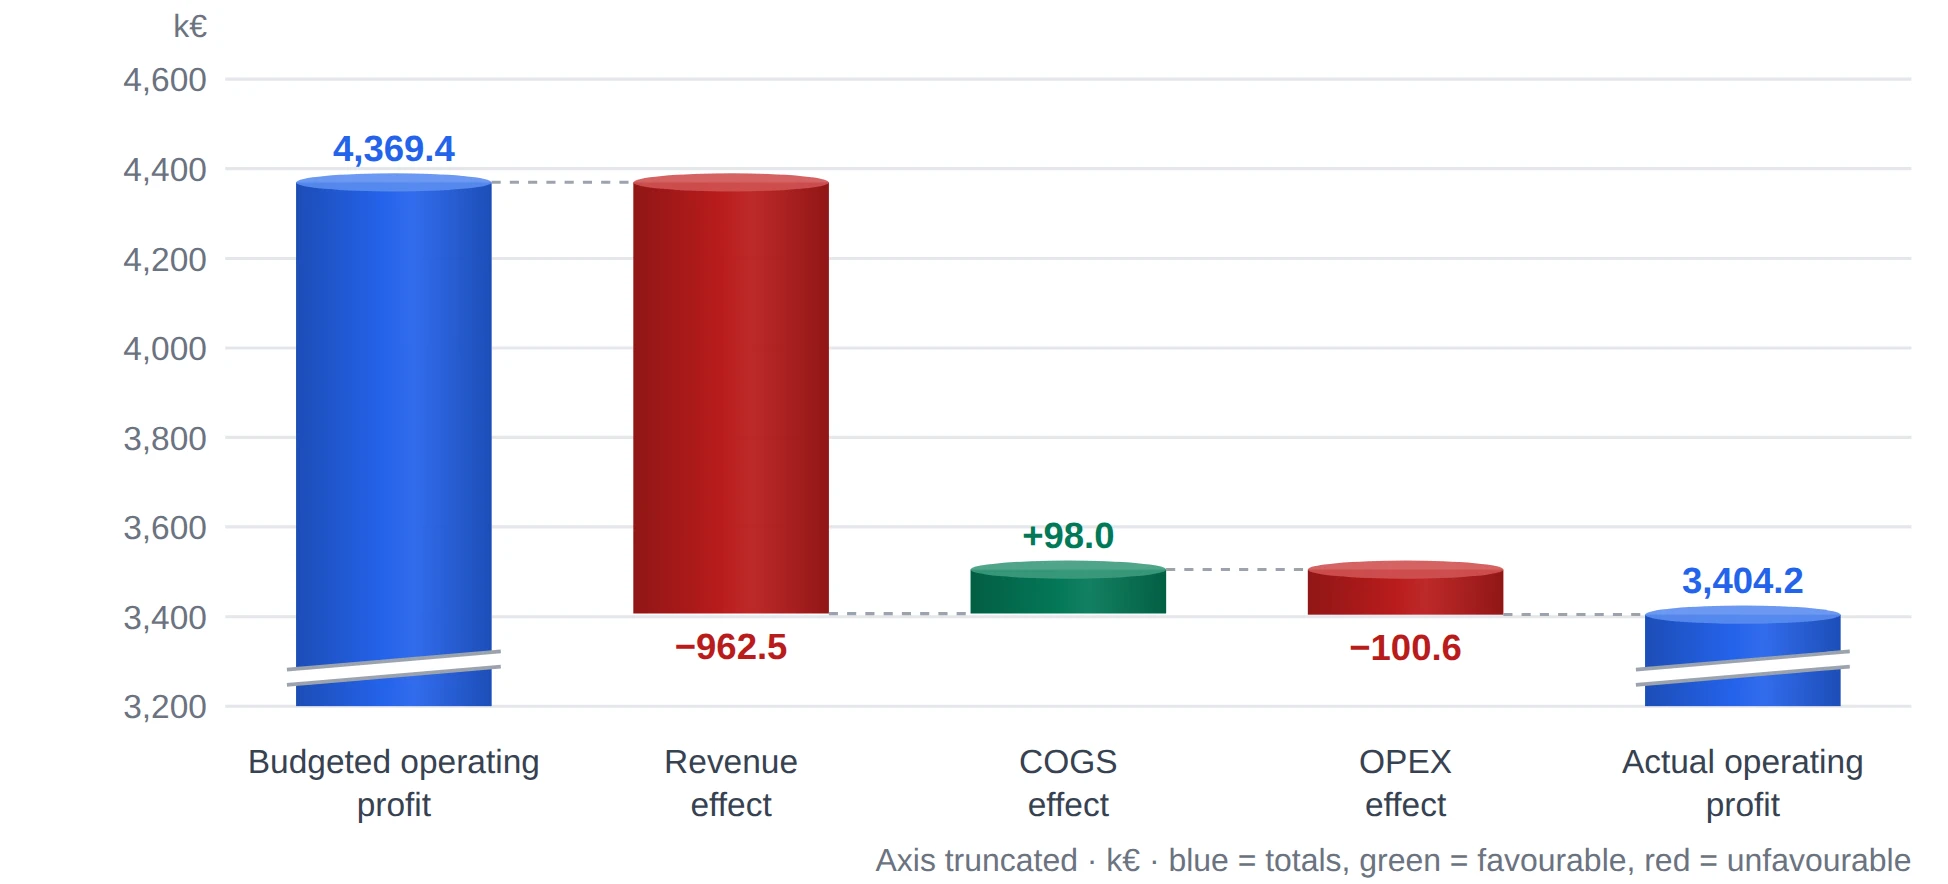
Silver operating profit bridge: budgeted operating profit 4,369.4 k€, revenue effect −962.5, COGS effect +98.0, OPEX effect −100.6, actual operating profit 3,404.2 k€
Real Silver output, computed by the Planova engine on the fictional demo dataset (Aurelia Sensors, 2024–2025).
  • Actual vs BudgetRevenue, COGS, OPEX and profit, by department
  • Reconciled to the centDetail and totals checked on every result
  • 3 scenariosPessimistic, Base and Optimistic from your assumptions
  • DEMO exportsCSV files at full precision, clearly labelled
The real FP&A problem

Budgets are not built once. They are rebuilt, round after round.

Finance, HR, Operations and Management exchange spreadsheets until the numbers hold. Each round reopens the same files — and every reforecast starts the cycle again.

  1. 01

    Data collection

    Actuals and inputs from every team

  2. 02

    Consolidation

    Files merged, totals reconciled

  3. 03

    Budget challenge

    Management questions the gaps

  4. 04

    Adjustments

    Assumptions changed by hand

  5. 05

    Revisions

    New versions, new checks

  6. 06

    Reforecast

    …and the cycle starts again

Repeated for every revision round — the time goes into rebuilding numbers, not into understanding them.

FinanceHROperationsManagement

Your finance team should spend less time rebuilding numbers — and more time challenging the business.

How Planova works

Three steps, from a CSV file to scenarios.

Silver follows the same path every time: your data, a clear diagnosis, then the forecast you choose to build.

01

Bring your financial data

Start instantly with the demonstration dataset. Planova checks every row before anything is computed. Importing your own data is planned for future commercial accounts and is not available yet.

  • Monthly Actual and Budget, by department and account
  • Missing columns and invalid rows are reported, never silently ignored
  • A month with no row is not treated as zero
Entity,Currency,Year,Month,Department,Account Category,Account Name,Type,Value (Local),Value (EUR)
AURELIA_DEMO,EUR,2025,March,Sales,Revenue,Product Sales,Actual,1465268.22,1465268.22
AURELIA_DEMO,EUR,2025,March,Sales,Revenue,Product Sales,Budget,1518700.00,1518700.00
AURELIA_DEMO,EUR,2025,March,Operations,COGS,Freight & Logistics,Actual,128109.01,128109.01
AURELIA_DEMO,EUR,2025,March,R&D,OPEX,R&D Salaries,Budget,164200.00,164200.00
Four rows of the sample file (fictional data) · Download Sample CSV ↓
02

Understand your performance

See Actual vs Budget for Revenue, COGS, OPEX and operating profit, the margins, and which departments drive the gap.

  • Favourable and unfavourable effects on operating profit
  • Contributions by department and category
  • Every figure comes from the Planova engine
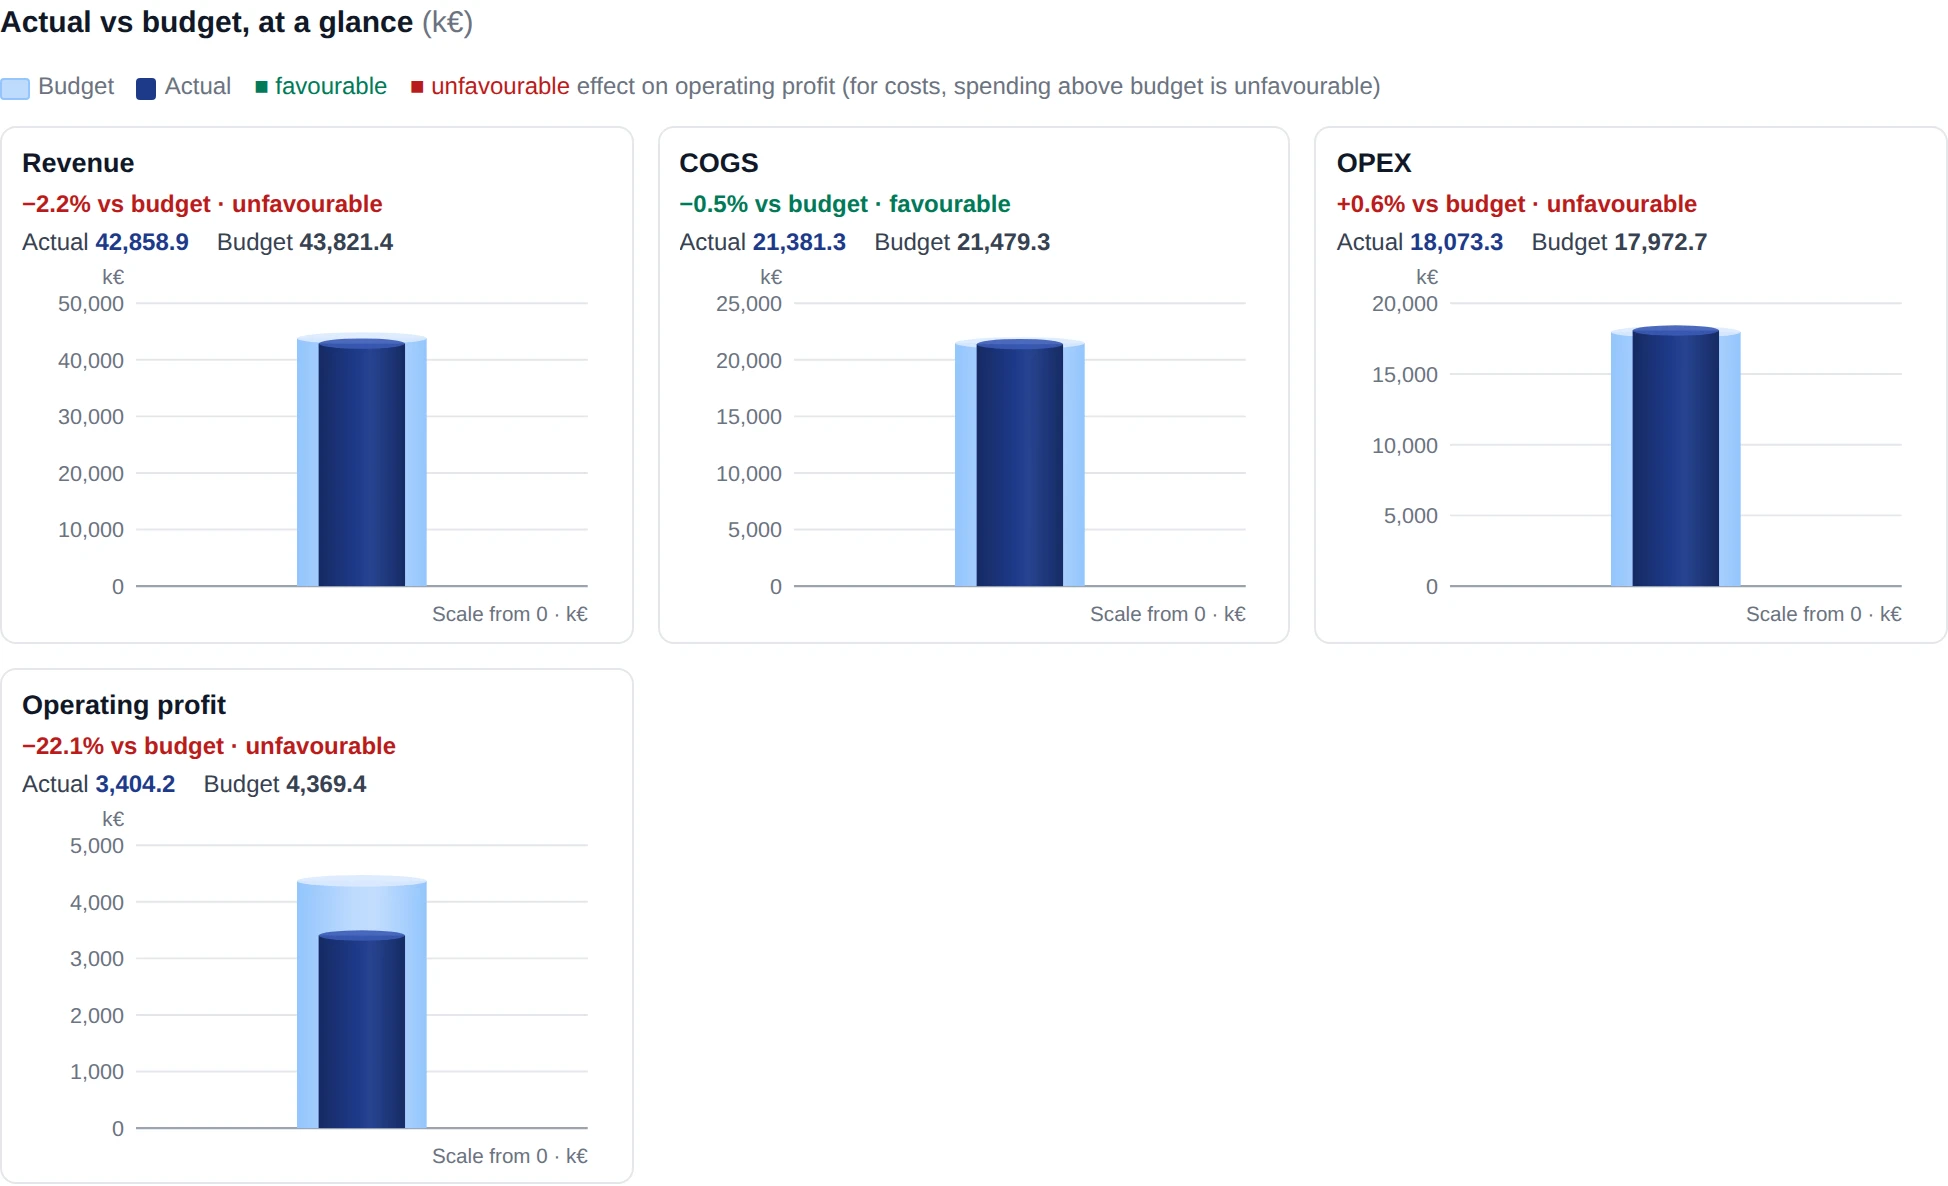
Silver Actual vs Budget comparison: revenue −2.2% vs budget, COGS −0.5%, OPEX +0.6%, operating profit −22.1%
Real Silver Step 2 · fictional demo dataset
03

Explore what comes next

Set your business assumptions — revenue growth, salary increase, other OPEX change, tax rate — and compare the forecast across three scenarios.

  • Each account projected from its own monthly history
  • Applied rates shown for every scenario
  • Monthly line-item export per scenario
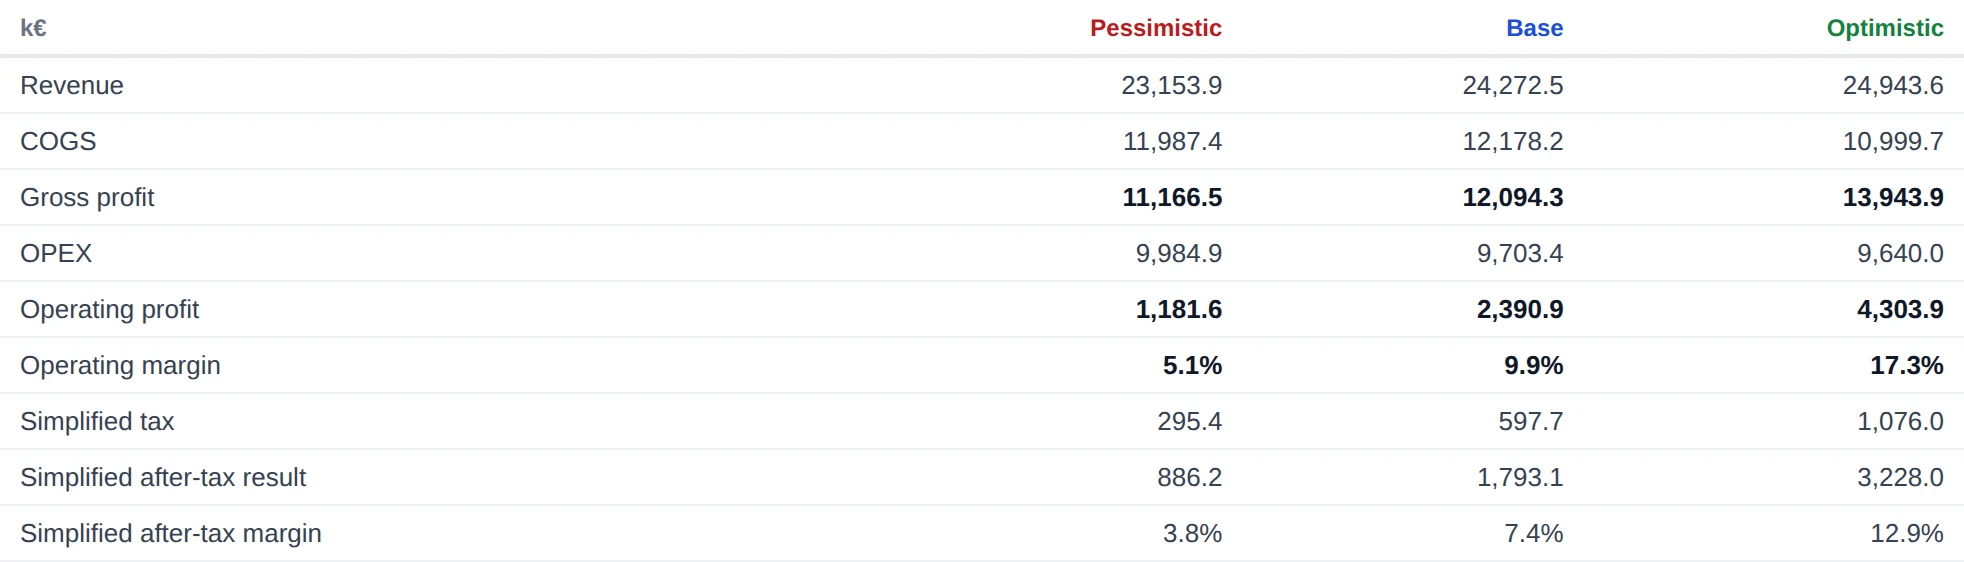
Silver 2026 scenarios in k€: operating profit 1,181.6 pessimistic, 2,390.9 base, 4,303.9 optimistic
Real Silver Step 3 · 2026 forecast on the fictional demo dataset
Financial intelligence

From financial reporting to financial understanding.

What Silver does today — shown on its real output, not on mock-ups.

Available

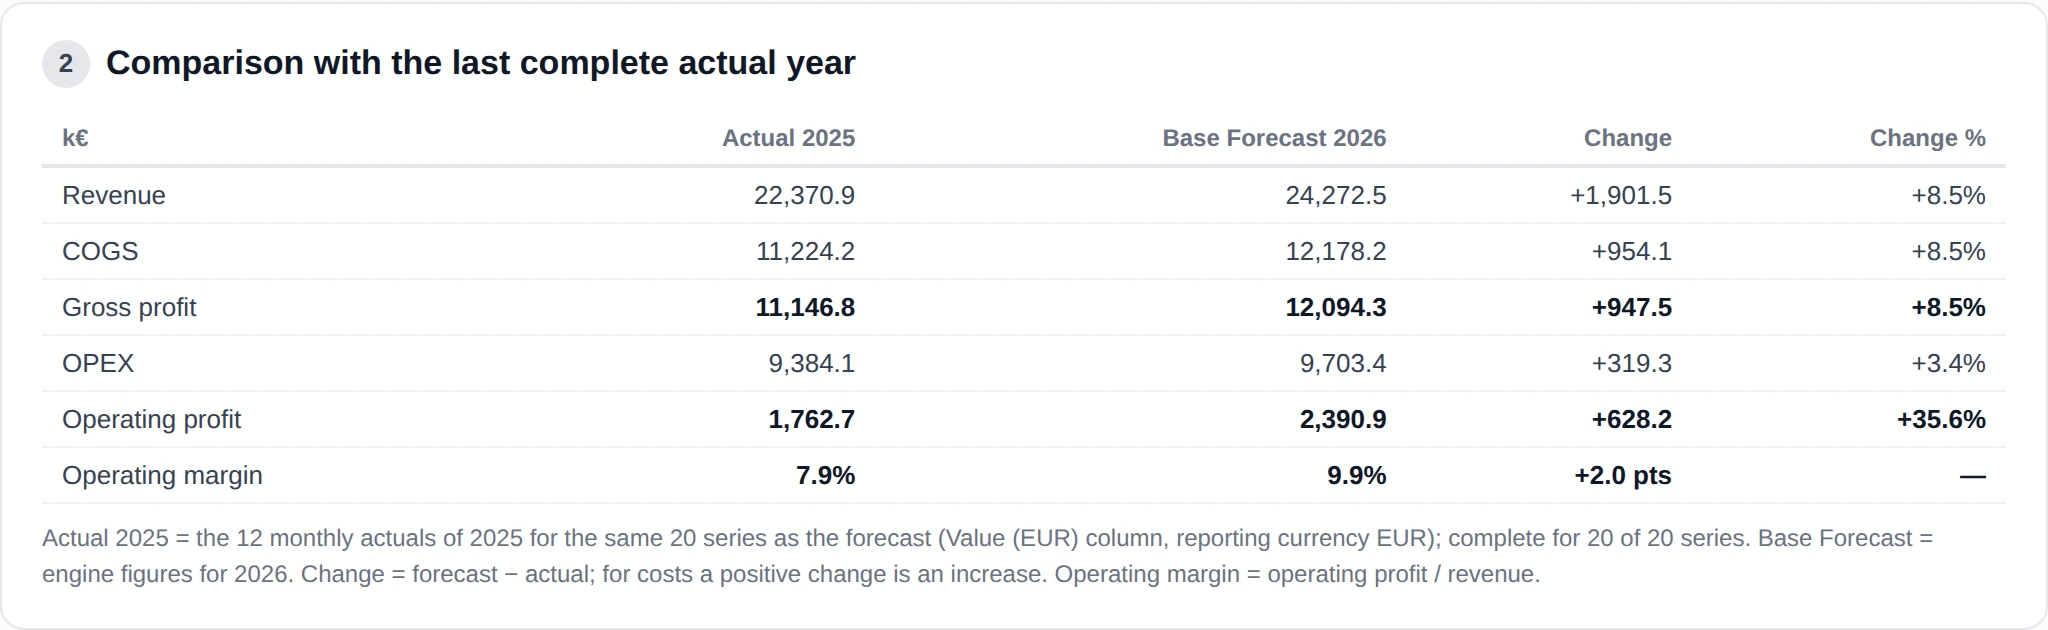
Forecast vs last actual year

Each forecast is compared with the last complete calendar year of actuals — Revenue, COGS, gross profit, OPEX, operating profit and margin.

Silver comparison of the Base forecast 2026 with actual 2025: revenue 22,370.9 to 24,272.5 k€, operating profit 1,762.7 to 2,390.9 k€
Available

Assumption transparency

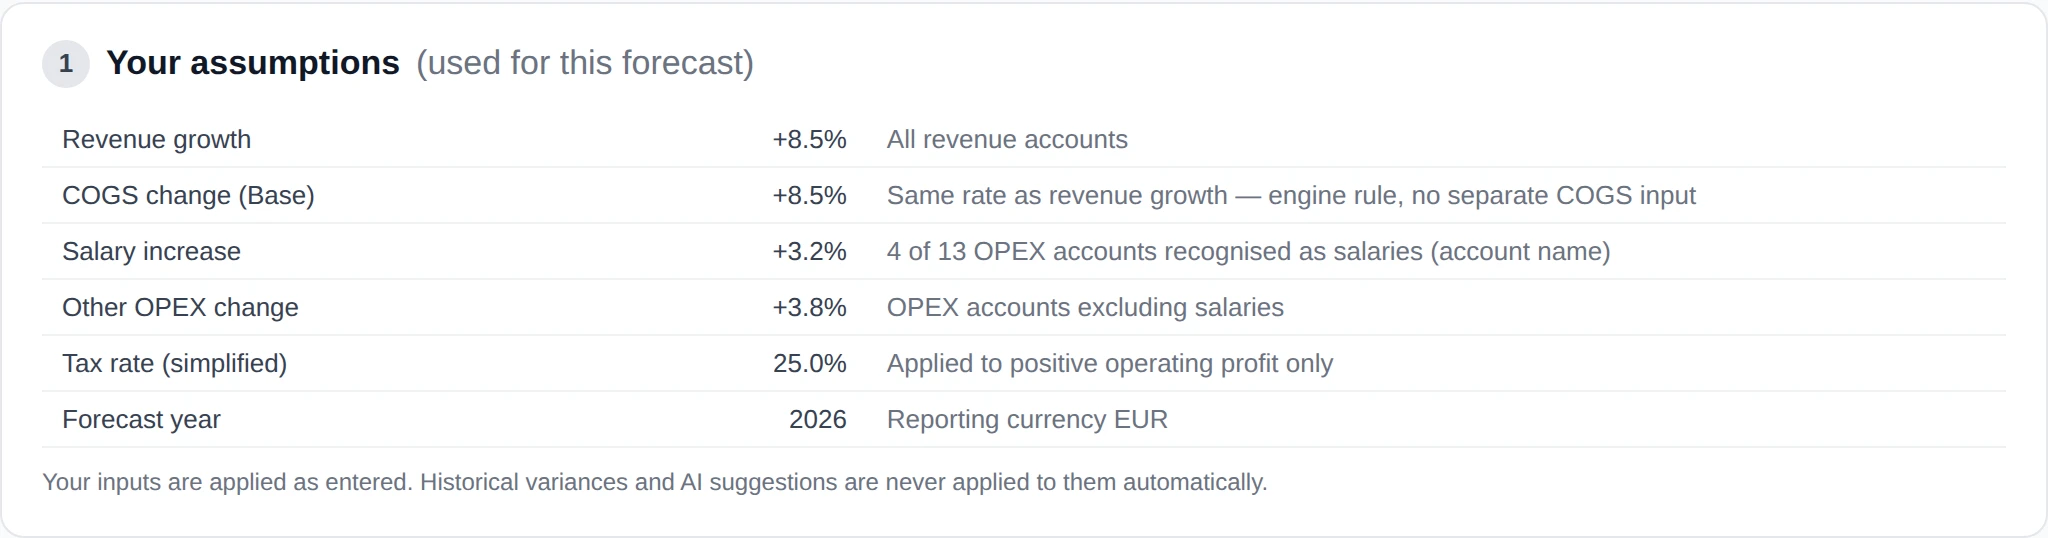
Your inputs are applied as entered and shown next to the results. Nothing from the analysis or from AI is applied to them automatically.

Silver assumptions table: revenue growth +8.5%, COGS +8.5%, salary increase +3.2%, other OPEX +3.8%, tax rate 25%, forecast year 2026
Available

Operating profit bridge

From budgeted to actual operating profit, step by step: revenue, COGS and OPEX effects, coloured by their impact, with truncated axes clearly marked.

Available

Revenue, COGS & OPEX

Gross profit, operating profit and margins — Actual vs Budget and per scenario, with salaries recognised separately from other OPEX.

Available

Reporting & exports

CSV exports to the cent for each scenario and a print-ready report, labelled DEMO in the Preview.

Optional · temporarily unavailable

AI explanations

An optional AI layer can add written interpretations, clearly labelled, that never change the figures. It is not active during the Preview: every result shown comes from the Planova engine.

In Silver, an optional AI layer (Google Gemini) adds written interpretations, clearly labelled, that never change the figures. Every figure comes from the Planova engine.

Free Preview

Experience Silver. No financial data required.

Explore the financial analysis and forecasting experience using realistic demonstration data. No registration and no company data needed.

Recommended · no file needed

Explore with Demo Data

Launch Silver with a ready-to-use dataset and go straight to the analysis and the forecast.

Aurelia Sensors, a fictional industrial company · 4 departments, 20 accounts · Actual & Budget 2024-01 → 2025-12 · forecast 2026 · EUR. All figures are synthetic.

Explore with Demo Data
Your company data

Real financial data

Real company financial data can only be processed after a commercial agreement and authorized account activation.

During the public Preview, Planova runs on the fictional demonstration dataset only, and the server refuses any other financial data. Joining Planova Early Access does not unlock real-data processing. Download the sample CSV ↓ to see the expected format.

Planova Early Access

Silver is temporarily available for free during the Preview phase. Future access will require membership.

Membership · Early Access

Silver is free today. Membership comes next.

Silver is Planova’s principal offering. After the Preview it will become member-only. Planova Early Access is a free waiting list — not a paid subscription or a commercial contract — to be told first when membership opens.

Silver

Analysis, forecast and scenarios

Open during the Preview · member-only afterwards

  • Fictional demo dataset, ready to use
  • Actual vs Budget by department
  • Revenue, COGS, OPEX and margins
  • Operating profit bridge
  • Line-item forecast, 12 months
  • Pessimistic, Base, Optimistic
  • Your assumptions, shown as applied
  • DEMO reports and CSV exports

Processing your own company data (CSV import, EUR/USD reporting) is planned for future commercial accounts and is not available yet. Gold and Platinum are future tiers under development. They are not available, and no date or price has been announced.

Join Planova Early Access

Be among the first to discover Planova Silver.

Early Access is free and uses synthetic demonstration data only. Registration does not activate a paid subscription or authorize processing of real company financial data.

By registering, you request updates about the Planova Early Access programme. Please review our Privacy Notice before submitting your information.

Only your email address, the date, the page you joined from and your consent are recorded — no tracking, no third-party service. Kept for at most 12 months.

FP&A guides

The analysis behind the Preview, explained.

Two short guides for finance teams, each linked to the worked demonstration in the Silver Preview.

FAQ

Frequently asked questions

What is Planova?

Planova is a financial planning and analysis platform being developed for growing organisations. Its public Silver Preview demonstrates budget vs actual analysis, line-item forecasting and three financial scenarios using synthetic data.

Can I upload my company's financial data?

Not during the public Preview. It runs exclusively on the fictional Aurelia Sensors dataset. Processing real company data requires a future commercial agreement and authorised account activation.

Does AI calculate the financial results?

No. The Planova financial engine computes the figures. AI explanations are disabled during the public Preview, and no AI interpretation is automatically applied to assumptions or results.

Which scenarios can I explore?

The Preview provides Base, Pessimistic and Optimistic scenarios. They represent explicit business assumptions, not probabilities or guarantees of future performance.

Your next financial decision deserves better intelligence.

Start with our demonstration dataset. Discover what Planova can reveal before importing your own financial data.

Explore Planova Silver